Visitor Journey
Definition
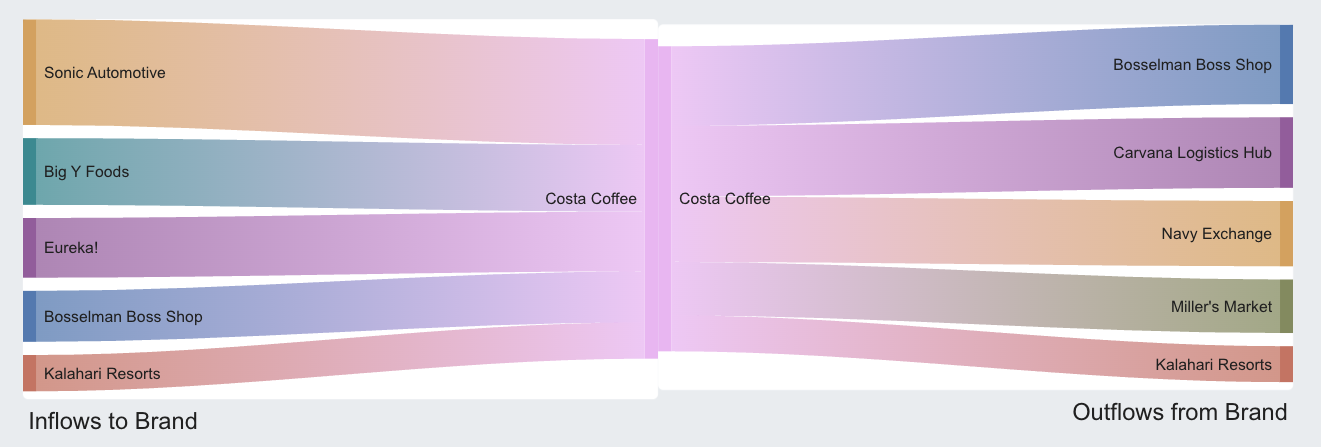
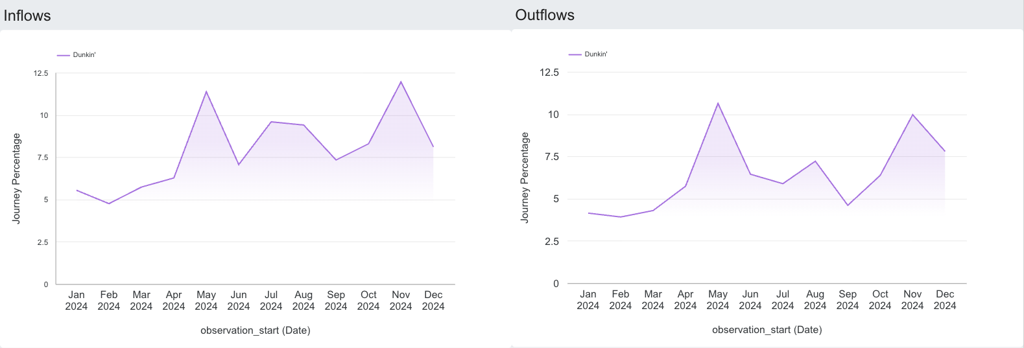
Visitor Journey is a metric that quantifies how people travel to and from a specific location. It captures both inflow and outflow patterns across points of interest (POIs), such as competitor stores, visitor's homes, and workplace locations. This metric provides insights into journeys between POIs and their relations. We provide monthly journey fractions representing the percentage of journeys associated with a specific POI.
Visitor Journey provides more granular insights, capturing directionality, temporal patterns such as daytime vs evening, weekday vs weekend, and immediate vs extended journeys. It also includes the average travel time and average distance between the area of interest (location_id) and related areas. In addition to these dimensions, each journey includes a confidence score that reflects the level of confidence in the given insight.
Journeys are categorized as follows:
- immediate - a journey lasting between 0-59 minutes (inclusive)
- extended - a journey lasting between 1-7 hours/60-420 minutes (inclusive)
- daytime - a journey starting between 7:00-16:59
- evening - a journey starting between 17:00-6:59
- weekday - a journey starting Monday through Friday
- weekend - a journey starting on Saturday or Sunday
What questions does it answer?
- Leakage: Are my customers going to a competitor right after visiting my store? What might I be missing?
- Brand loyalty: Are they loyal to just my brand or do they visit similar brands too?
- Marketing effectiveness: Are you attracting new visitors or pulling from the same base? Compare journey patterns before and after a campaign. Are customers coming directly from home? (high intent, often tied to marketing)
- Store operations: When do people visit? Are you staffed accordingly?
- Competitive analysis: Are my customers loyal within the category (e.g., always go to your coffee shop) or do they switch frequently? Which other brands do customers visit?
Methodology
Unacast uses 1st party data providers to access premium data to produce Visitor Journey statistics. This approach keeps all location data privacy-friendly and is not connected to any specific device ID. The location data is aggregated as statistics in the data partners' environment for the different dimensions of interest and then transferred as a feature to Unacast where it is treated as a feature to mixed model that actually creates the end result of Visitor Journeys. Unacast calculates the most likely statistical significance of observed journey on monthly cadence. In the Visitor Journey we introduced new metric called confidence score which represents our confidence in the observations made by our model.

Limitations
- The maximum size of a polygon handled by Visitor Journey is 200 000 m². Polygons with area greater than that will be discarded. Too small polygons, such as ATMs, will receive lower confidence score as their area makes more difficult compute precise journeys.
- We provide at most 50 inflow journeys and 50 outflow journey (max 100 journeys in total).