Popular Times
Definition
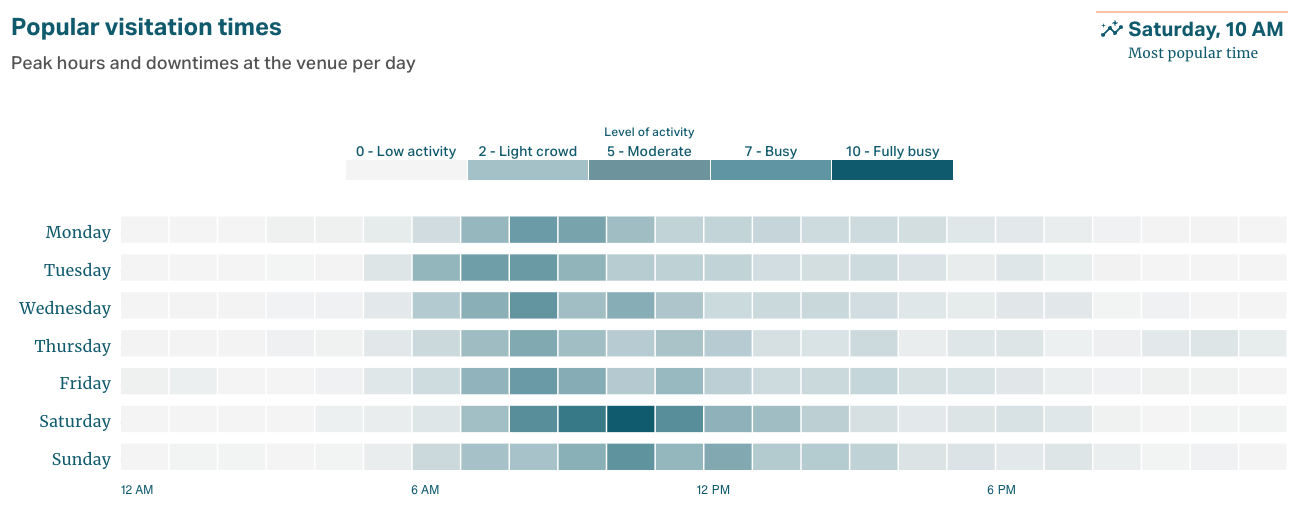
Popular Times provides insights into the typical weekly visitation patterns at a location, highlighting peak and off-peak hours. Using occupancy metrics, it reveals when a location generally experiences higher or lower visitor traffic throughout a standard week. Popular time has a lag of 14 days, so it will be produced at the 15th of the new quarter. E.g. for the 2024-07-01 to 2024-09-30 quarter, it would be produced on the 2024-10-15.
Occupancy
The metric measures occupancy which is a prediction of how many people were staying at the location within each hour of the week. Occupancy is represented as a number between 0 and 1 (normalized on a weekly basis), where 1 is the peak occupancy for the location across a typical week and 0 means a prediction of no traffic at all. Occupancy numbers are modeled from our predictions of non-residents of the location staying there within each hour of the week.
Limitations
Metrics are not produced for locations larger than 70,000 sqm; these locations will not have any results. Only 1% of venues are affected.
Availability
Popular Times data is currently only available as a quarterly metric. This means the output does not contain specific timestamps or weekly breakdowns for historical time periods. Instead, the data represents the typical weekly pattern observed over the given quarter. It answers when a location is typically busy or quiet during a standard week, not on specific calendar dates.
What questions does it answer?
- What is the most popular day of a week or hour at the location?
- When is the location usually less crowded?
- How does visitor traffic vary across different days of the week?
- Is the location consistently busy at certain times, or does it fluctuate?