Query
This is an early access enterprise service. Send an inquiry to Unacast about your interest.
The Query API allows you retrieve Unacast data-assets on-demand.
As we are in the first innings of externalising these APIs we only have a limited example show-cased, based on conversation we will offer specific instructions to solve your use-case. These APIs serve several Insight applications by Unacast, and have extensive functionality not showcased here quite yet.
cURL Example
You can find the API specification here
The following example is for fetching all data for one location for one metric. Upon integration you will receive specific documentation on the specific values to use on your requests.
curl -H 'authorization: Bearer <YOUR_PROVIDED_TOKEN>' -G \
    https://httpgateway.unacastapis.com/v1/catalogs/rwg/metrics/<METRIC_TO_QUERY>/values?billingContext="<YOUR_PROVIDED_ORG_ID>"&featureFilter="<LOCATION_ID"
A specific example we will fetch foot-traffic data for a Census Block Group in Boulder, CO.
curl -H 'authorization: Bearer <YOUR_PROVIDED_TOKEN>' -G \
    https://httpgateway.unacastapis.com/v1/catalogs/rwg/metrics/foot_traffic_byo_202306_series_us_block_group_2020_0_monthly_0/values?billingContext="<YOUR_PROVIDED_ORG_ID>"&featureFilter="080130132053"
Python Example
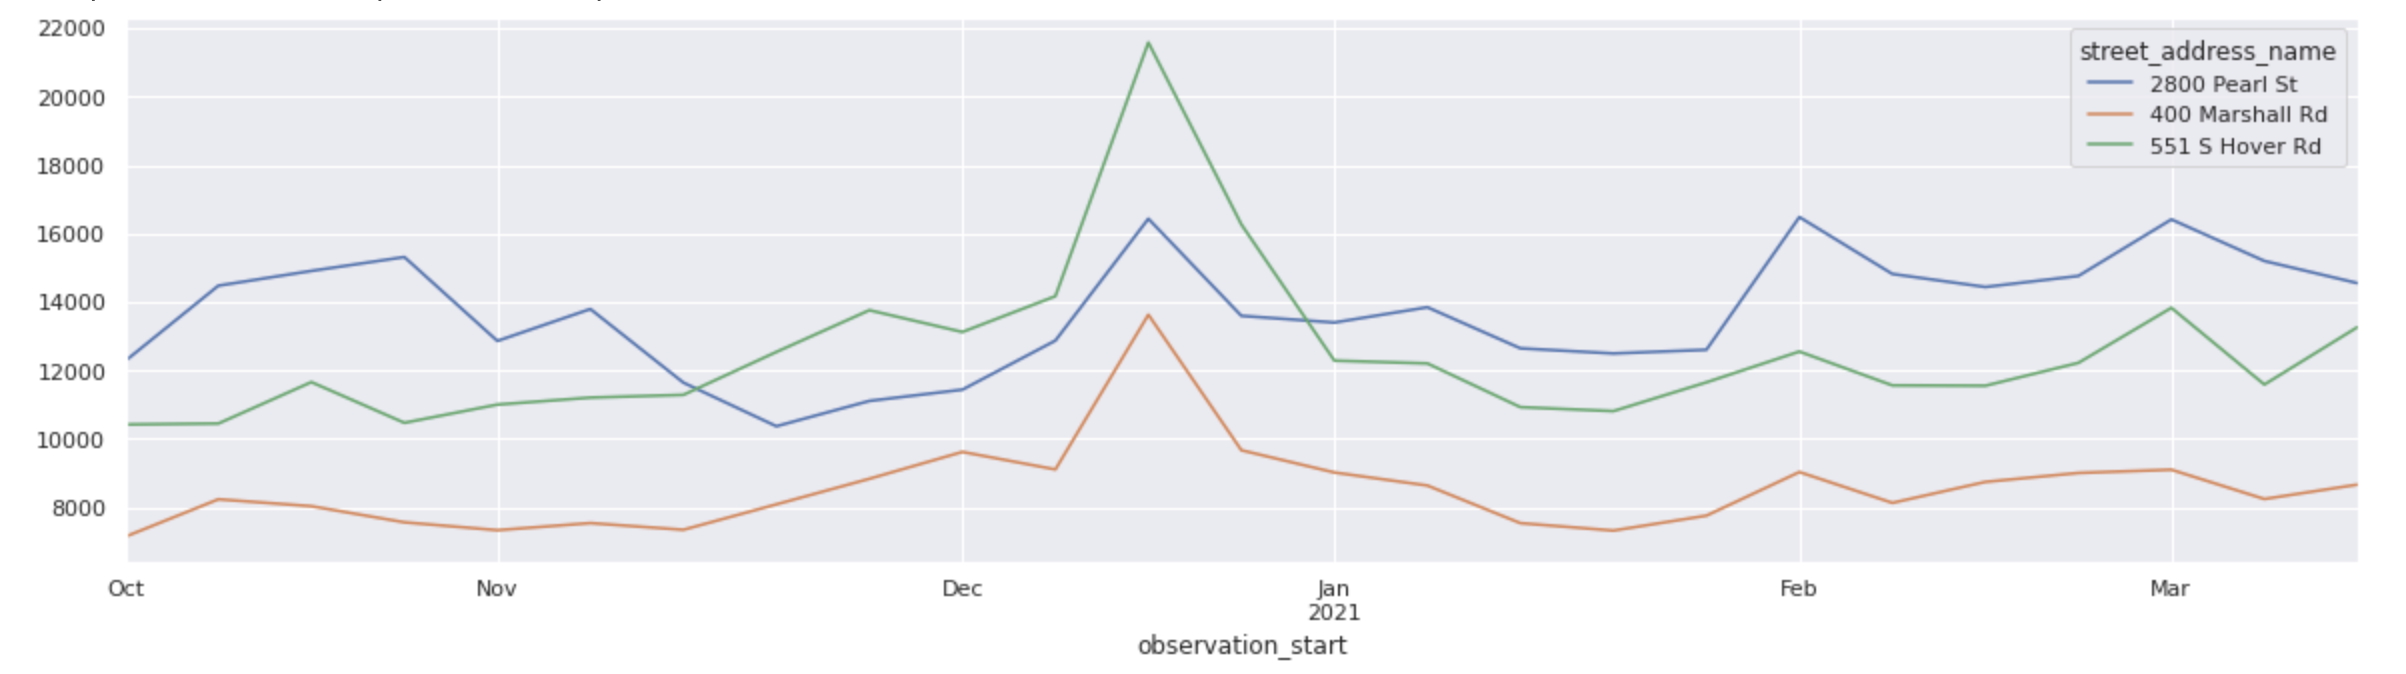
Below is an example of plotting the foot-traffic timeseries of Target locations in San Diego.
For Python we have the unacatlib library which provide some helper methods to for example map output data into data frames.
import seaborn as sns; sns.set(color_codes=True)
import matplotlib.pyplot as plt

from unacatlib.client import Client

ucat = Client(server_address='catalog.unacastapis.com', token="YOUR_API_KEY")
rwg = client.catalog("rwg")

rwg.metric("foot_traffic_weekly") \
  .with_filter(Filter() \
  .with_address_component_search(rwg.address_component("city"), "san diego") \
  .with_address_component_search(rwg.address_component("brand"), "target") \
  .with_period_filter(datetime.date(2020,10,1), datetime.date(2021,3,28))) \
  .values() \
  .pivot(index="observation_start", columns="street_address_name", values="person_count").plot(figsize=(20,5))
The code above executed in a notebook produces the following chart:
Typescript Example
The below example is built with Remix, the file is a standard route-file in a remix project.
Here we do a very simple fetch of one record of Foot Traffic data. For filtering of data, discovery etc guidance will be provided based on the specific use case.
import { Metadata, credentials } from "@grpc/grpc-js";
import { json } from "@remix-run/node";
import { useLoaderData } from "@remix-run/react";
import { QueryServiceClient } from "@unacast-internal/unacat-js/unacast/catalog/v1/query_service_grpc_pb";
import type { SearchMetricValuesResponse } from "@unacast-internal/unacat-js/unacast/catalog/v1/query_service_pb";
import { SearchMetricValuesRequest } from "@unacast-internal/unacat-js/unacast/catalog/v1/query_service_pb";

const fetchData = async () => {
  const queryClient = new QueryServiceClient(
    "catalog.unacastapis.com",
    credentials.createSsl()
  );

  const reqMetadata = new Metadata()
  reqMetadata.add('Authorization', 'Bearer ' + process.env.YOUR_PROVIDED_API_KEY)

  const request = new SearchMetricValuesRequest()
    .setCatalogId("rwg")
    .setBillingContext("YOUR_ORGANIZATION_ID")
    .setMetricId("foot_traffic_monthly")
    .setPageSize(1);

  return await new Promise<SearchMetricValuesResponse.AsObject>((resolve, reject) => {
    queryClient.searchMetricValues(
      request,
      reqMetadata,
      (err, response) => {
        if (err) {
          reject(err);
        } else {
          resolve(response.toObject());
        }
      }
    )
  })
}


export async function loader() {
  return json({
    res: await fetchData()
  })
}

export default function Page() {
  const { res } = useLoaderData()
  return (
    <pre>
      {JSON.stringify(res, null, '\t')}
    </pre>
  )
}
Below you see the response as printed by the application
{
    "valuesList": [
        {
            "metricId": "4ae78298-d20c-4dfb-8459-d96c27563c20",
            "observationPeriod": {
                "start": {
                    "year": 2019,
                    "month": 11,
                    "day": 1
                },
                "end": {
                    "year": 2019,
                    "month": 11,
                    "day": 30
                }
            },
            "mapFeatureV2": {
                "layerId": "poi_layer",
                "featureId": "uc_87c5_5087-32c6d4dc446bbac148c0f51327688515-4c7dc9b5bcf15475541822e32a7954f1_a537",
                "name": "",
                "geo": "",
                "addressComponentsList": [
                    {
                        "component": "street_address",
                        "value": "9998 Main St",
                        "shortName": "",
                        "displayName": "9998 Main St"
                    },
                    {
                        "component": "h3",
                        "value": "8a0cdd00ab17fff",
                        "shortName": "",
                        "displayName": "8a0cdd00ab17fff"
                    },
                    {
                        "component": "naics_2017",
                        "value": "491110",
                        "shortName": "",
                        "displayName": "Postal Service"
                    },
                    {
                        "component": "us_state_2020",
                        "value": "02",
                        "shortName": "AK",
                        "displayName": "Alaska"
                    },
                    {
                        "component": "us_cbsa_2020",
                        "value": "",
                        "shortName": "",
                        "displayName": ""
                    },
                    {
                        "component": "us_block_group_2020",
                        "value": "020130001003",
                        "shortName": "020130001003",
                        "displayName": "020130001003"
                    },
                    {
                        "component": "us_zip_2010",
                        "value": "99661",
                        "shortName": "99661",
                        "displayName": "99661"
                    },
                    {
                        "component": "us_tract_2020",
                        "value": "02013000100",
                        "shortName": "02013000100",
                        "displayName": "02013000100"
                    },
                    {
                        "component": "sic_2019",
                        "value": "4311",
                        "shortName": "",
                        "displayName": "United States Postal Service"
                    },
                    {
                        "component": "city",
                        "value": "Sand Point",
                        "shortName": "",
                        "displayName": "Sand Point"
                    },
                    {
                        "component": "us_county_2020",
                        "value": "02013",
                        "shortName": "Aleutians East",
                        "displayName": "Aleutians East Borough, AK"
                    },
                    {
                        "component": "brand",
                        "value": "ucb_87c5_e8822a6f-ae56-4a9c-93b8-57dfb4b4f687_bcab",
                        "shortName": "",
                        "displayName": "United States Postal Service (USPS)"
                    },
                    {
                        "component": "is_obfuscated",
                        "value": "false",
                        "shortName": "",
                        "displayName": "false"
                    }
                ]
            },
            "dimensionsList": [],
            "supportingValuesList": [
                {
                    "name": "person_count_p50",
                    "unit": "People",
                    "number": 0,
                    "count": 98,
                    "category": ""
                }
            ],
            "value": {
                "name": "person_count",
                "unit": "People",
                "number": 0,
                "count": 2841,
                "category": ""
            },
            "flagsList": []
        }
    ],
    "appliedFilters": {
        "periodFiltersList": [],
        "dimensionFiltersList": [],
        "addressComponentFiltersList": [
            {
                "component": "is_obfuscated",
                "valuesList": [
                    "false"
                ]
            }
        ],
        "featureFiltersList": [],
        "relatedFeatureFiltersList": []
    },
    "totalSize": 33246814,
    "nextPageToken": "eyJDb3JyZWxhdGlvbklEIjoiY2twODdrcTIzYWtnMDBkNTljZzAiLCJWYWx1ZXMiOnsiYnFQYWdlVG9rZW4iOiJCSEk2QVVTTlJNQVFBQUFTQTRFQUFFRUFRQ0FBS0dRRUJBQVJBQUpBV0NYQktTVVdBSUZHT0NRVUJJRVhLWVpOT1ZYR0NZM0JPUUkzUE8zTkVDR0FBQUFBQ0lVVjZaQlRNVTJER01aUUdFM1RBTkpSTUZTR01ZWlpHWVpEUU5CV0c1UVRPWVpVR0pRV0dNQlJHVTNHR1pCVUdRNFdJR1JFTVk0VEdaSlpHSlJET0xKV01JMkdHTEpVRzQyVEVMSlpHVTREUUxMQk1FWldLTlpUTVFaRENNREZHTUpFSVlMT041WERDT0RFRzVSR01aQldIRlJXQ09CVUhFMkdHTVRFR01ZREtZUldHUTRUTVlKUUdaUVRPTkRGR1k0R0NaTEJIQTRESU5SV01KU0RDTkRHTU0zRFNNREVNTlREQU5MQk1ZM0dHWTNHR0VOR0tNSllNUTNXRVpURUdZNFdHWUpZR1E0VElZWlNNUVpUQU5MQ0dZMkRTTlRCR0EzR0NOWlVNVTNEUVlMRk1FNERRTkJXR1pSR0lNSlVNWlJUTU9KUU1SUldNTUJWTUZURE1ZM0RNWVlTR1pMQ0dNWURNTUpTTU1XV0lZUlVHRVdUSU4zRUdNV1dDWkRHTVlXVENOQlJHVTRESU1KWU1ZM0RBWkk9Iiwiam9iUmVmIjoiam9iX2Vla0c1WDZmX1A2RFY5MkNpZmdOSno4eVYtNzAifX0="
}