Methodology
General
The Visitation datasets support POIs, CBGs, and custom boundaries insights in the US. Two methodologies are utilized to build the different datasets:
- Our latest machine learning model to estimate foot traffic, trade areas, and demographics.
- Our aggregation model that extrapolates and aggregates GPS data for all other metrics. We gather GPS data from smartphones and mobile apps, with opt-in consent from users (all of our data is privacy-compliant).
Visitation Datasets & Metrics
| Datasets/Locations | Point Of Interests (POIs) | Census Block Groups (CBGs) | Custom Boundaries |
|---|---|---|---|
| Foot Traffic | ✔️ | ✔️ | ✔️ |
| Trade Areas | ✔️ | ✔️ | ✔️ |
| Demographics | ✔️ | ✔️ | ✔️ |
Dataset: Foot Traffic
Foot Traffic is a collection of metrics providing additional context to what is happening at a given location.
Metric: Visits (visits_sum and visits_p50)
Visits estimates the amount of unique people with a stay at a location in a day.
Any person is included in this count, including workers and residents.
The metrics is reported in the following values:
visits_sum: the sum of daily visits across the aggregation period (week and month)visits_p50: the typical (median) daily visits across the aggregation period (week and month)
The Visit metric estimates are derived from Unacast's proprietary machine learning model.
Here a story of how machine learning can change the location data industry for the better.
Foot Traffic Methodology
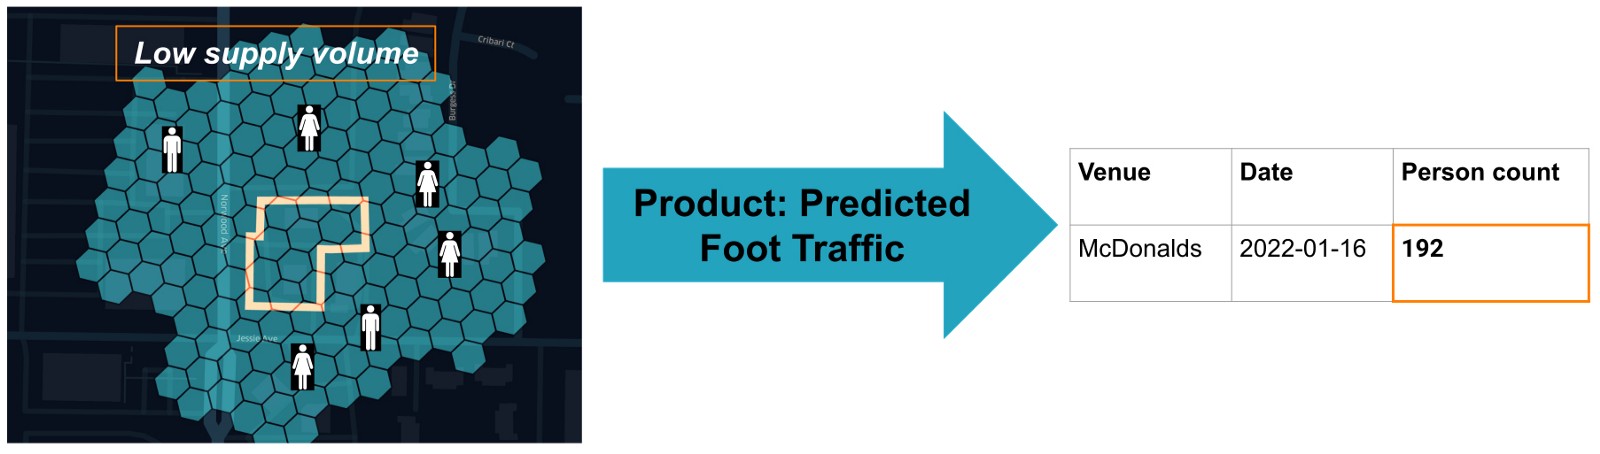
We estimate the visits to a location by using a machine learning model. The model learns the relationships between various types of context and person count of that location. One important input to our model is derived from privacy-friendly 1st party GPS data. We aggregate that data on the 1st party side and use the derived aggregates on a hexagon level as input to our ML model.
Unlike typical aggregated products that rely solely on aggregating the underlying GPS device-level supply, our machine learning model is more robust and less dependent on GPS data fluctuations because it is based on a magnitude of different data sources to estimate visits.
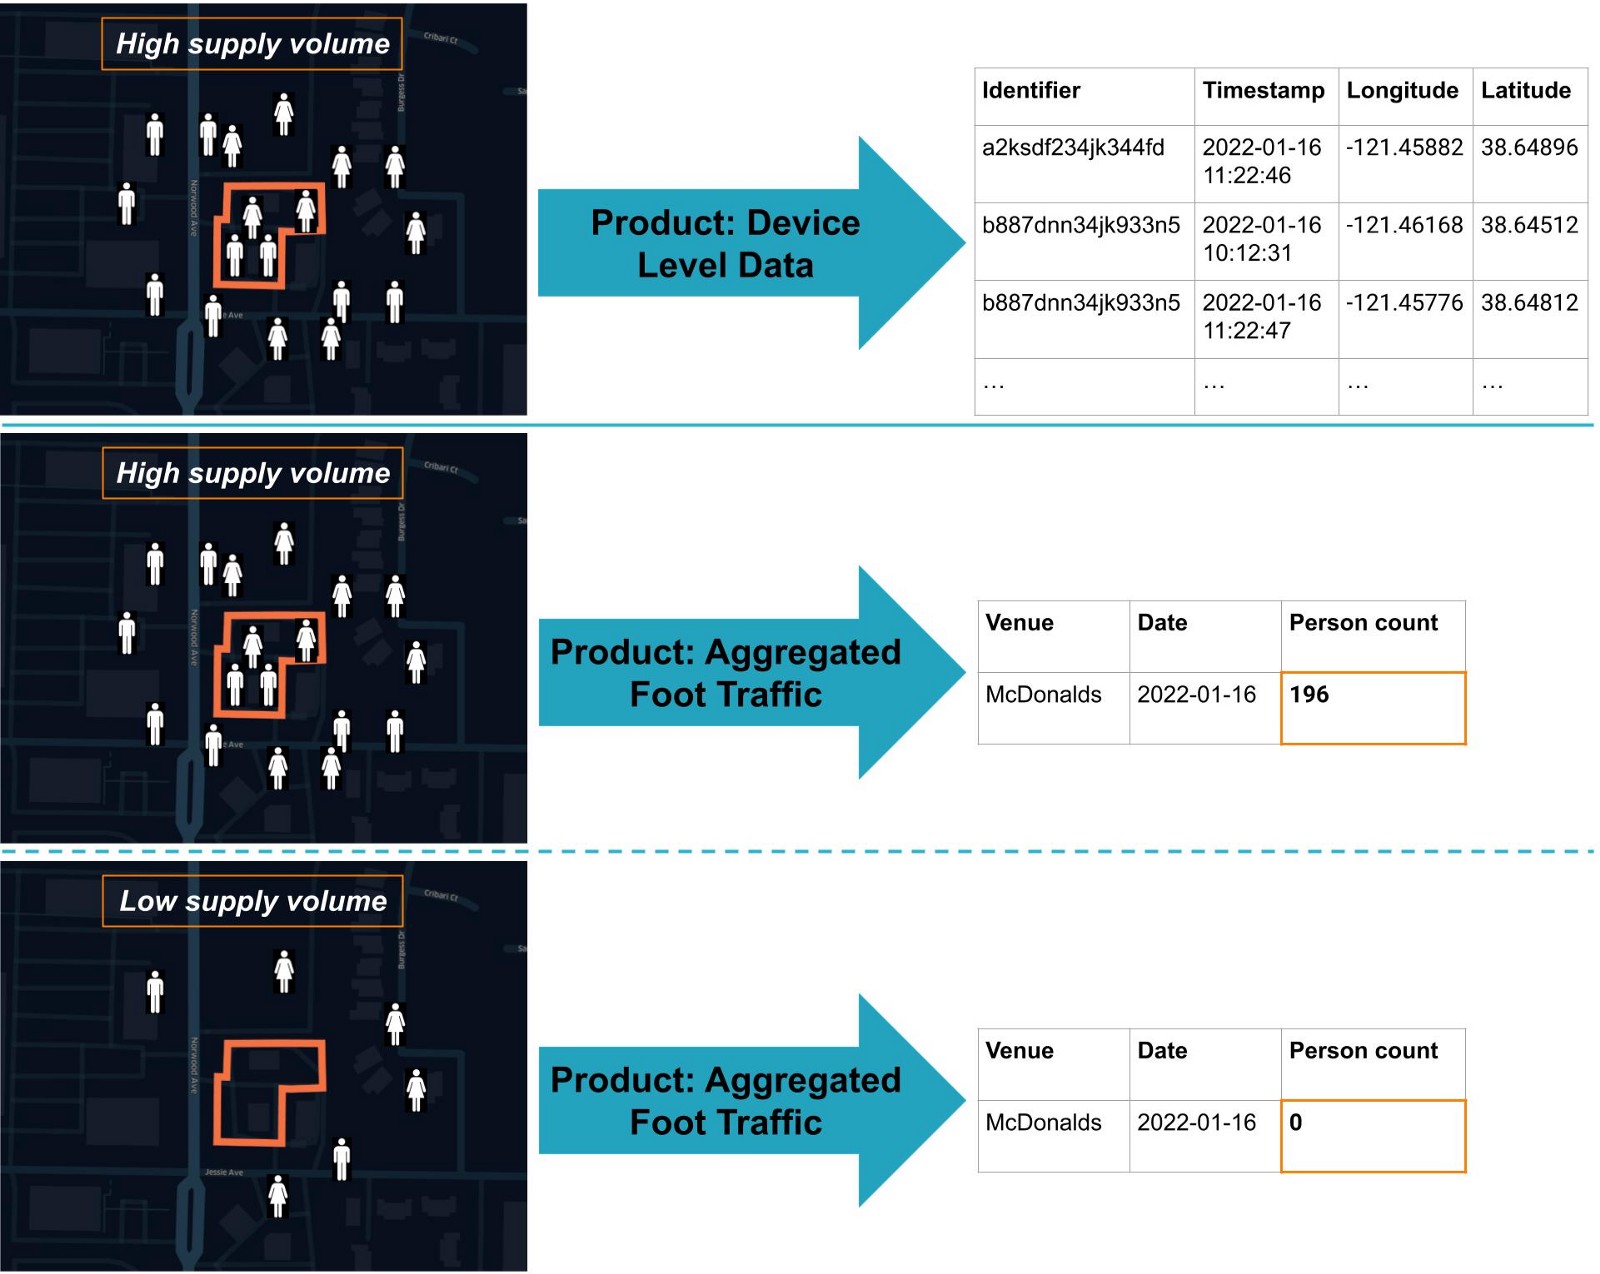
Using machine learning, we are able to overcome these supply problems and create a more robust product.
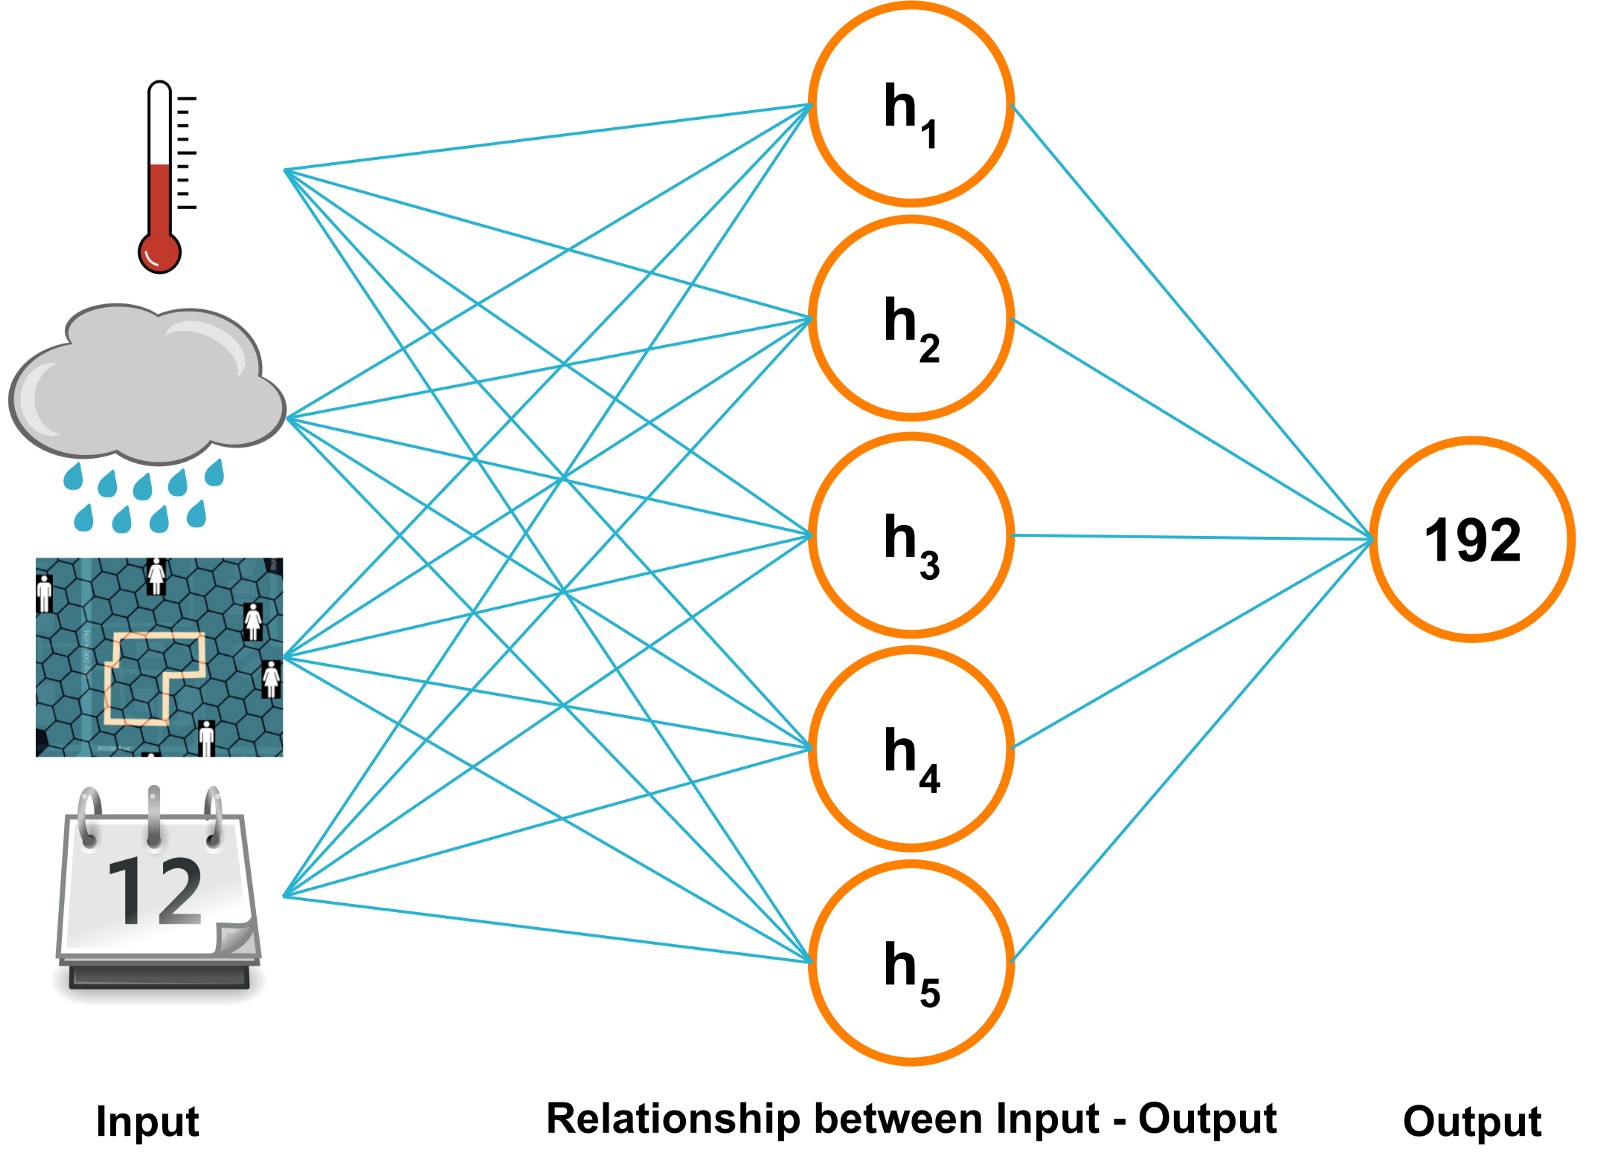
Underlying Contexts in the Model
We use multiple sources of context as features in our machine learning model to estimate the visits. Some of these are:
- Number of people in the vicinity
- Venue square footage
- Local demographics (such as income)
- Holidays
- Day of the week
- Historical data
- People at a location
In total, the model comprises more than 120 features to train those relationships based on our long history of high-quality location data.
Dataset: Trade Areas
Trade Areas describe the origin of visitors to a specific location of interest based on their home or work location. The origin area is defined as a Census Block Group (CBG).
Metric: People Fraction
The people fraction shows the percentage breakdown of visitors from each CBG based on their home or work location. For instance, this metric describes the percentage of the location visitors having their home in a specific CBG.
Trade Areas describe the home and work CBGs for all the visitors to a location.
You might in some cases encounter records with people_fraction = 0.0, this might happen as we trim this number to 3 decimal points. If you encounter this it means the origin is estimated to account for <0.1% of visits to the location while still having at >5,000 visits.
Trade Areas Methodology
Trade Areas are based on our new machine learning model. To define the person_fraction, we use several data sources as inputs into our model partly derived from 1st party GPS data and partly derived from other data sources.
The aggregates which are based on our 1st party GPS utilise Unacast's proprietary supply correction, extrapolation, and Home & Work algorithm.
Underlying Contexts in the Model
We use multiple sources of context as features in our machine learning model to estimate the people fraction. Some of these are:
- Number of people in the vicinity
- Home and Work aggregates per Hexagon
- Origin-Destination metrics
- Venue square footage
- Historical data
- People at a location
Dataset: Demographics
Demographics are build on top of our Trade Areas and, thus, are combining the output from our trade areas ML model with Census Demographics.
Metric: People Fraction (Demographics)
The people fraction shows the percentage breakdown of visitors to a given location based on the census demographics of their home origin. For instance, this metric estimates the percentage of the location visitors being between 20 and 25 years old.
Demographics (age, income, education and race) can help identify what type of people visited a given location.
Demographics Methodology
To determine the demographics of a location's visitors, we use a home-derived methodology on to of our Trade Areas model. Simply put, we look up the fraction of visitors per home area. Based on the Census demographics per area, we can estimate the demographics of people visiting that location.
Privacy
We wholeheartedly believe that privacy is a concept to which every human that uses a connected device has a fundamental right — and it’s built into every part of our business.
Please take a look at our privacy section for more information.