Release Notes
Release notes summarize changes from the previous product version to this version. This is mostly of interest for existing customers who want to be informed about the latest changes and potential impact on their analysis.
Visitation Datasets v202401
Release Notes v202401
General
The new version of our Visitation Datasets with the following updates:
- We added a breakdown of the total person_count metric for foot traffic into: Residents, Workers, and Non Resident Non Worker
- Changes has been made to a handful of the input features used in the foot traffic model to ensure processing windows does not have effect on outputs
- The Trade Area model has been improved to let the people-fraction more accurately represent share of visits coming from a given origin
- Cut-offs in the Trade Area model has been made more dynamic to better represent destination type locations
- person_count will be renamed visits (visits_sum and visits_p50) in standard datasets
Quality check of the visitor types
Accessing ground truth data for human behaviour is challenging, yet, we performed thorough testing of those metrics by looking into:
- Back-to-office for large company headquarters
- Major manufacturing facilities
- Covid19 impacts on workers and residents for offices and residential areas
- Visitor-to-Worker relationship for different industry codes
- Amusement parks
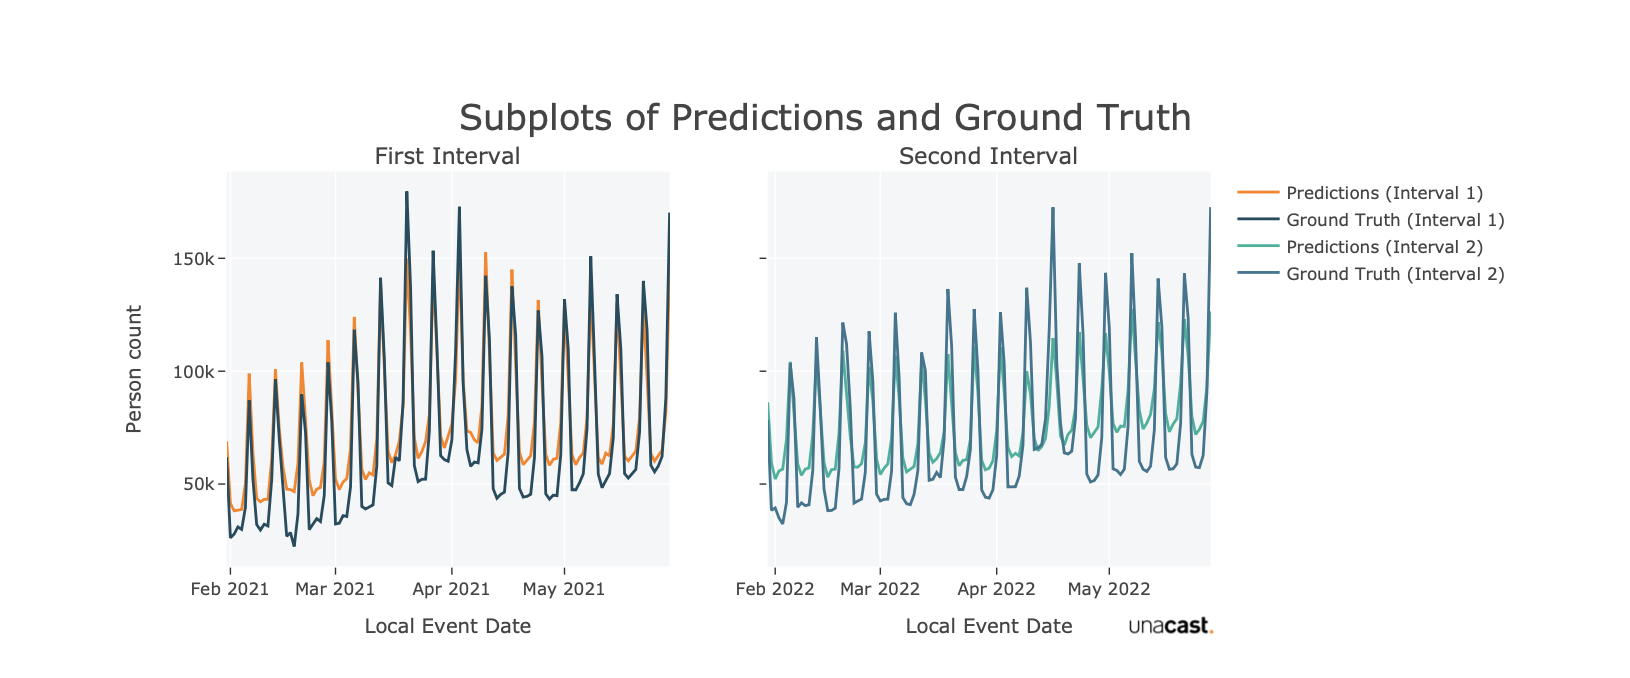
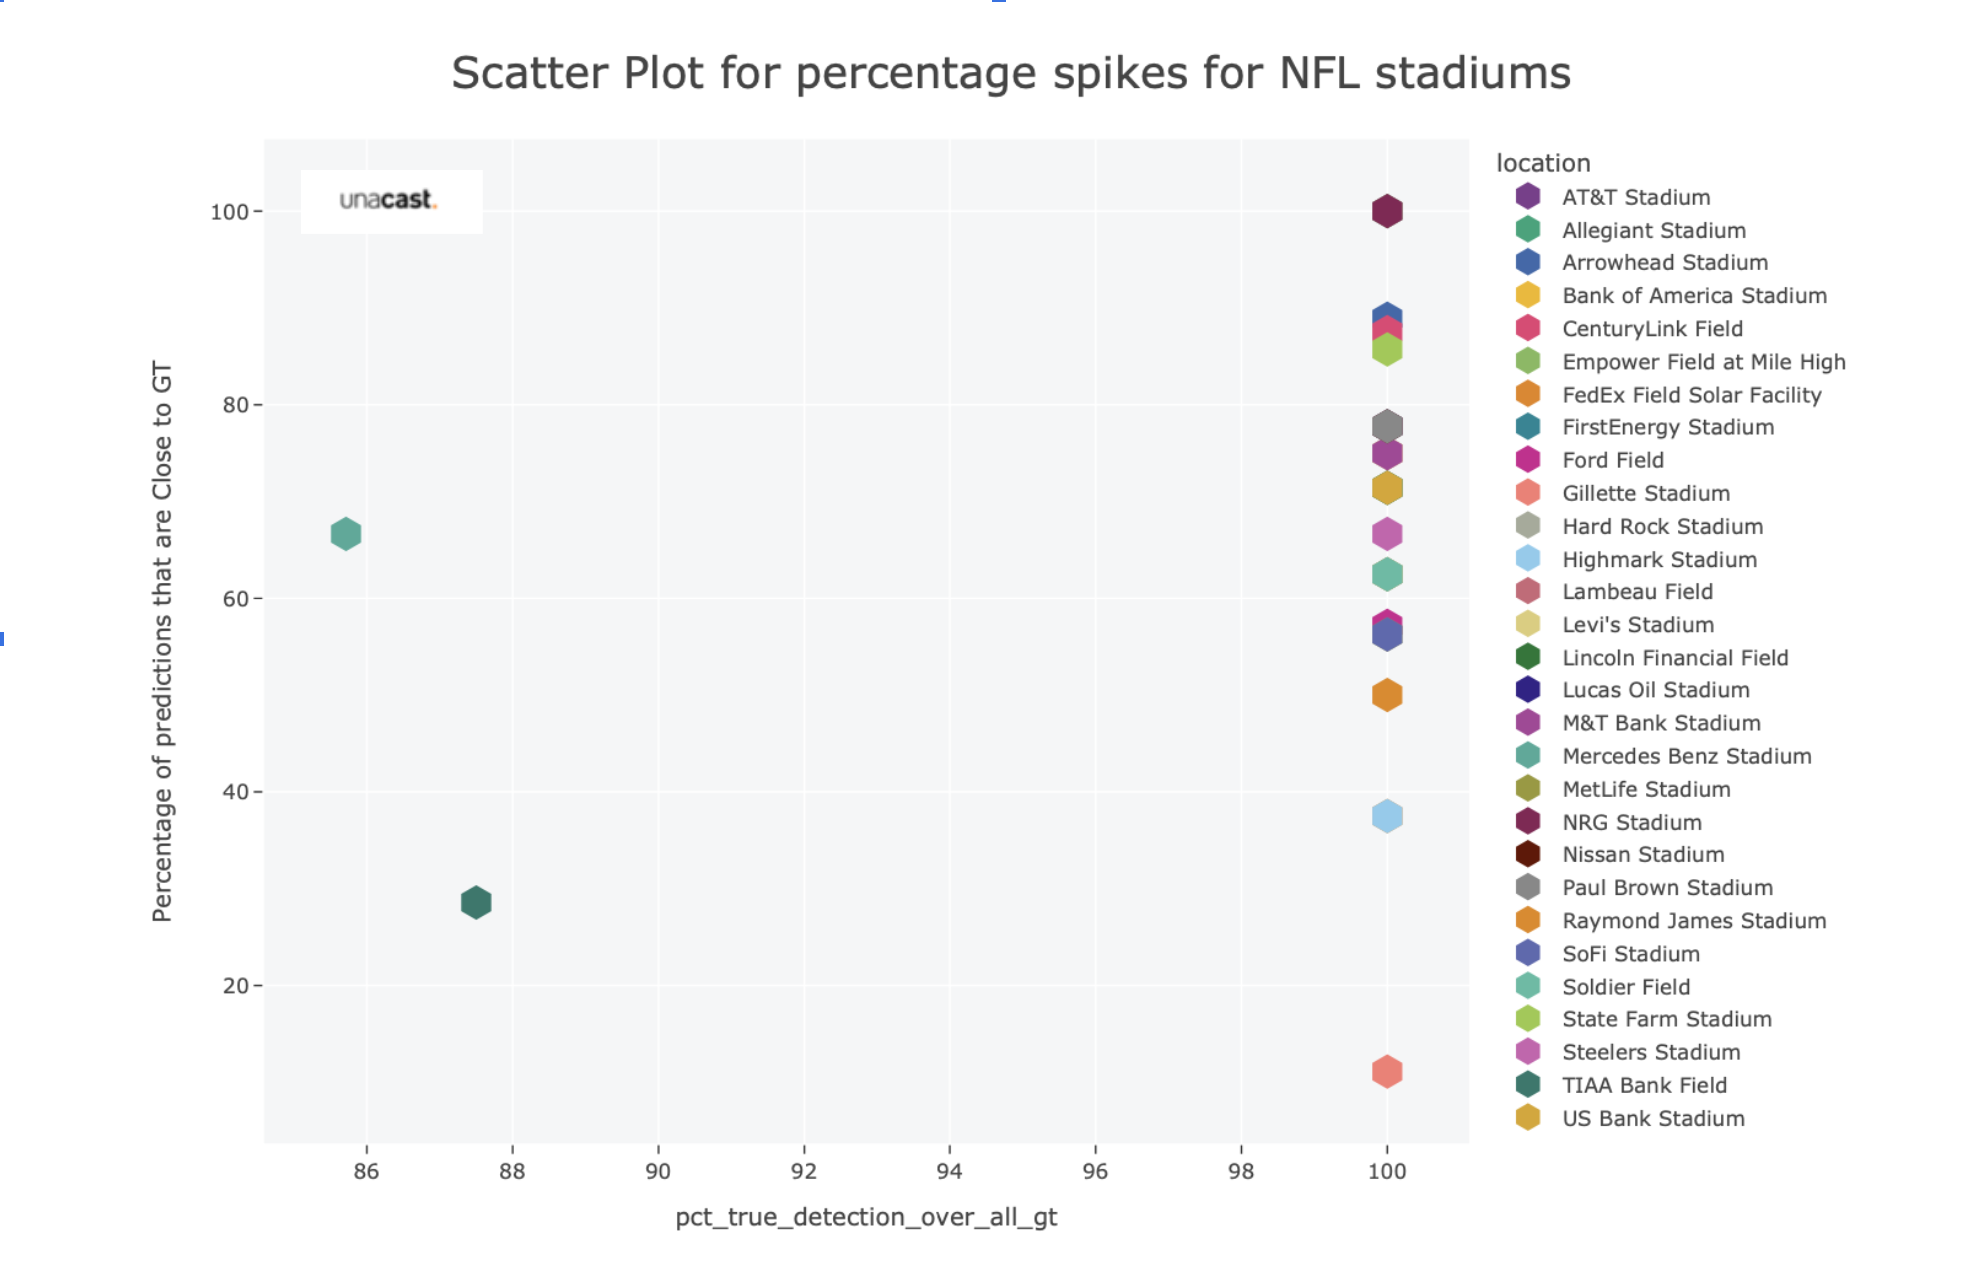
- NFL stadium events
ML model performance
The visitor type metrics are estimated using a boosted tree model which showed the following test set performance:
- Median Absolute Error of the fraction:
- R squared of the fraction:
Performance on selected test cases
| Description | Value |
|---|---|
| Average workers ratio of manufacturing facilities | 0.24 |
| Average Covid19 workers drop in office buildings | 21% |
| Average Post-Covid workers recovery in office buildings | 35% |
| Average percent difference between estimated residents and Census population | 13% |
| Average residents ratio in residential areas | 0.30 |
| Average work-from-home percent increases with Covid19 onset | 20% |
| Average ratio of visitors for retail locations | 0.85 |
| Average percent difference of visitor-to-worker ratio between high and low customer service NAICS codes | 160% |
Visitation Datasets v202309
Release Notes v202309
General
The new version of our Visitation Datasets comes with these major updates:
- We improved our POI coverage from 500k to 1.44 million locations.
- We trained a new machine learning model that uses twice as many features and is using 10x more training data.
- We use our new machine learning methodology also for Trade Areas and Demographics datasets.
Differences in this version
In this latest version of the Visitation dataset, we've made substantial enhancements that significantly boost the performance of our machine learning (ML) model. Firstly, we've broadened our dataset by incorporating a larger number of Points of Interest (POIs), which is a pivotal step towards enhancing our ML model's accuracy and effectiveness.
Additionally, our model is now based on twice the number of features, equipping it with a richer set of attributes and, thereby, facilitating a more comprehensive understanding of the data. Beyond these improvements, we've extended the application of our model to different domains, including Trade Areas and Demographics datasets. This diversification underscores the versatility and adaptability of our ML model, as it can now tackle a broader spectrum of data-related challenges.
Quality check of ML model
Accessing ground truth data for human behaviour is challenging, yet, we performed thorough testing of our model using the available dataset. The results demonstrate a strong correlation between our predictions and the ground truth data, affirming the reliability of our model's performance.
Feature updates
- Visitation Dataset comes with twice as many features in ML model.
- Visitation Dataset comes with 10x more training data for ML model.
- Trade Areas + Demographics coming as predictions based on new ML model.
Improvements
From a data perspective, the enhancement of our Point of Interest (POI) dataset plays a pivotal role in refining our model. With a tenfold increase in training data, our model benefits from a richer array of features, resulting in substantial improvements.
The extended utilization of our model for Trade Areas and Demographics datasets signifies a noteworthy development. It underscores the versatility of our model's applications.
After conducting a comprehensive data quality assessment, we're able to showcase strengths and limitations of the product in detail. That will enable future improvements and speed up new releases.
Known Limitations
Our models are fine-tuned to excel at identifying patterns, but they may occasionally struggle when it comes to precisely estimating absolute values. This tendency is particularly noticeable in the case of smaller venues or datasets. This valuable insight will be taken into account as we work on the next iteration of our model, ensuring that it becomes even more accurate and dependable.
Colocated POIs (like locations inside a mall) might show the exact same visitation metrics. This is due to our underlying map provider not differentiating those locations in their polygons. This issue impacts only colocated POIs and is further improved on in future releases.
Visitation Datasets v202303
Release Notes v202303
General
Visitation Datasets v202303 comes with three major changes:
- Visitation to locations is now based on a machine learning model rather than on data aggregation.
- To reduce the amount of individual tables, several metrics are bundled together into only seven datasets. The daily visitation metric was removed because it contained too much noise.
- Locations are restricted to the retail industry.
Differences in this Version
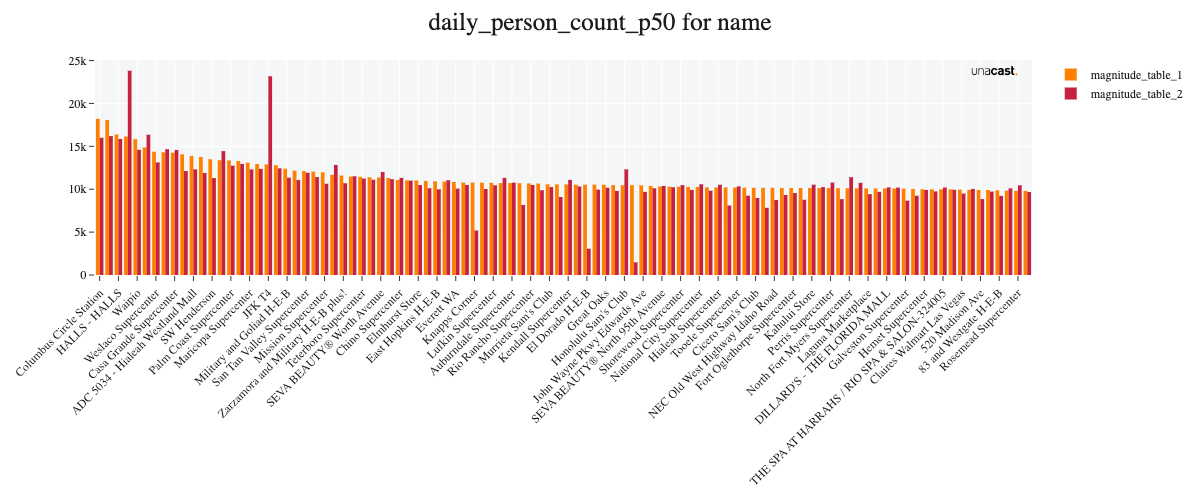
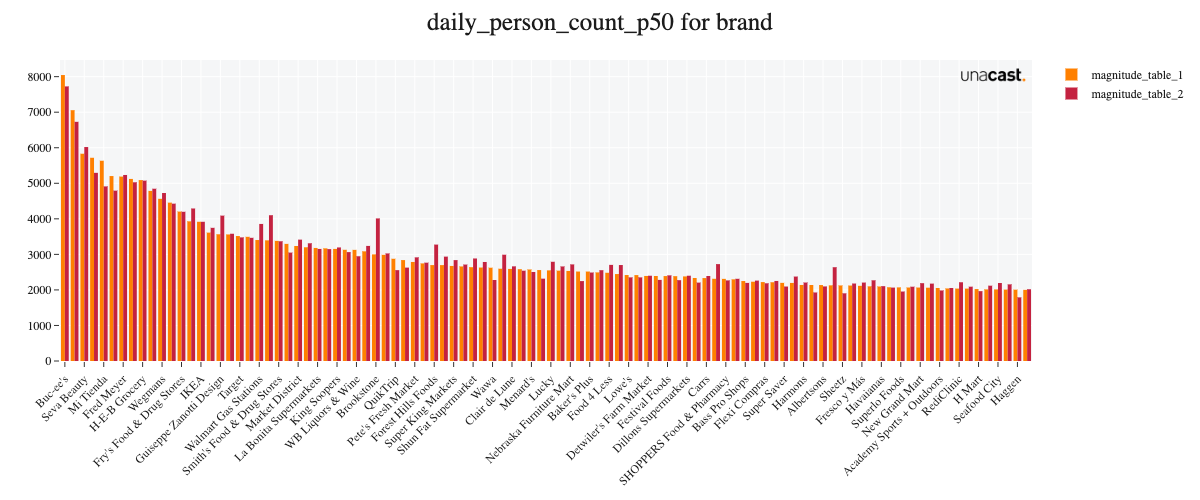
From a data perspective, the biggest changes in this version are due to the new methodology - using a machine learning model to estimate foottraffic. Therefore, we focus on those differences here and investigate changes to the weekly visitation compared to the previous version.
Comparing the new versions' weekly foot traffic to the previous version for the year 2021, we see strong similarities. The mean percentage difference between the versions in absolute volume range between +16% (state level) to -1% (brand level), where a positive number indicates an increased estimate in the new version. We do also observe high similarities when correlating those absolute volumes across venues ().
Feature updates
- Visitation Dataset comes by default with a four-day lag. Meaning that the data is available after four days.
- Dynamic Trade Areas contain a fraction and do not show the absolute person_count anymore.
- Cross Visitation focuses now on the venue-to-brand comparison since this was most requested by customers.
Improvements
- With switching to a machine learning model to estimate visitation, we improved the robustness of the product. The previous product version was subject to volatility in underlying changes in the raw GPS supply.
- Several venues that previously had too little GPS supply (and thus data) are now included with visitation estimates.
- With the new bundling of tables, there are fewer tables to download.
- We now have the capability to include other data sources that can improve our modeling. Previously, visitation numbers were estimated solely based on GPS data. This is now complemented by additional contextual data.
Known Limitations
- For a limited number of locations, the model estimates the same visitation over time (creating a flatline). Affected locations most often include convenience stores, drug or toy stores, or gas stations. These affected stores tend to be small-sized locations. Attention will be directed to those venues in the next revision.
- Visitation estimates are better in more urban areas This stems from the fact that mobility data is inherently more available in metropolitan areas. The larger the amount of data, the closer we can estimate to the underlying ground truth of that location.
- We observe a peak of elevated visitation in October 2022. Thereafter, visitation tends to fluctuate more. Nevertheless, it appears that more urban locations are less affected.
- The algorithm has been trained on historical data. Any unpredictable event that severely affects human mobility at local or national scale (e.g., natural catastrophe or pandemic) will not be captured by our algorithm immediately, but will require an update once time has passed.
Overall it is important to highlight that machine learning models will be improved over time. With that, this new version will only get better with each future version and, thus be less dependent on external factors (like new privacy regulations on GPS data).